The AI-Ready Semantic Layer practice.
For mid-market multi-unit operators on Snowflake or Databricks. We turn fragmented warehouses and inconsistent BI metrics into one governed semantic layer that Tableau, Power BI, Cortex Analyst, Databricks Genie, and your AI agents all read from — designed, deployed, and handed off to your team in 60 to 120 days.
Numbers from real engagements
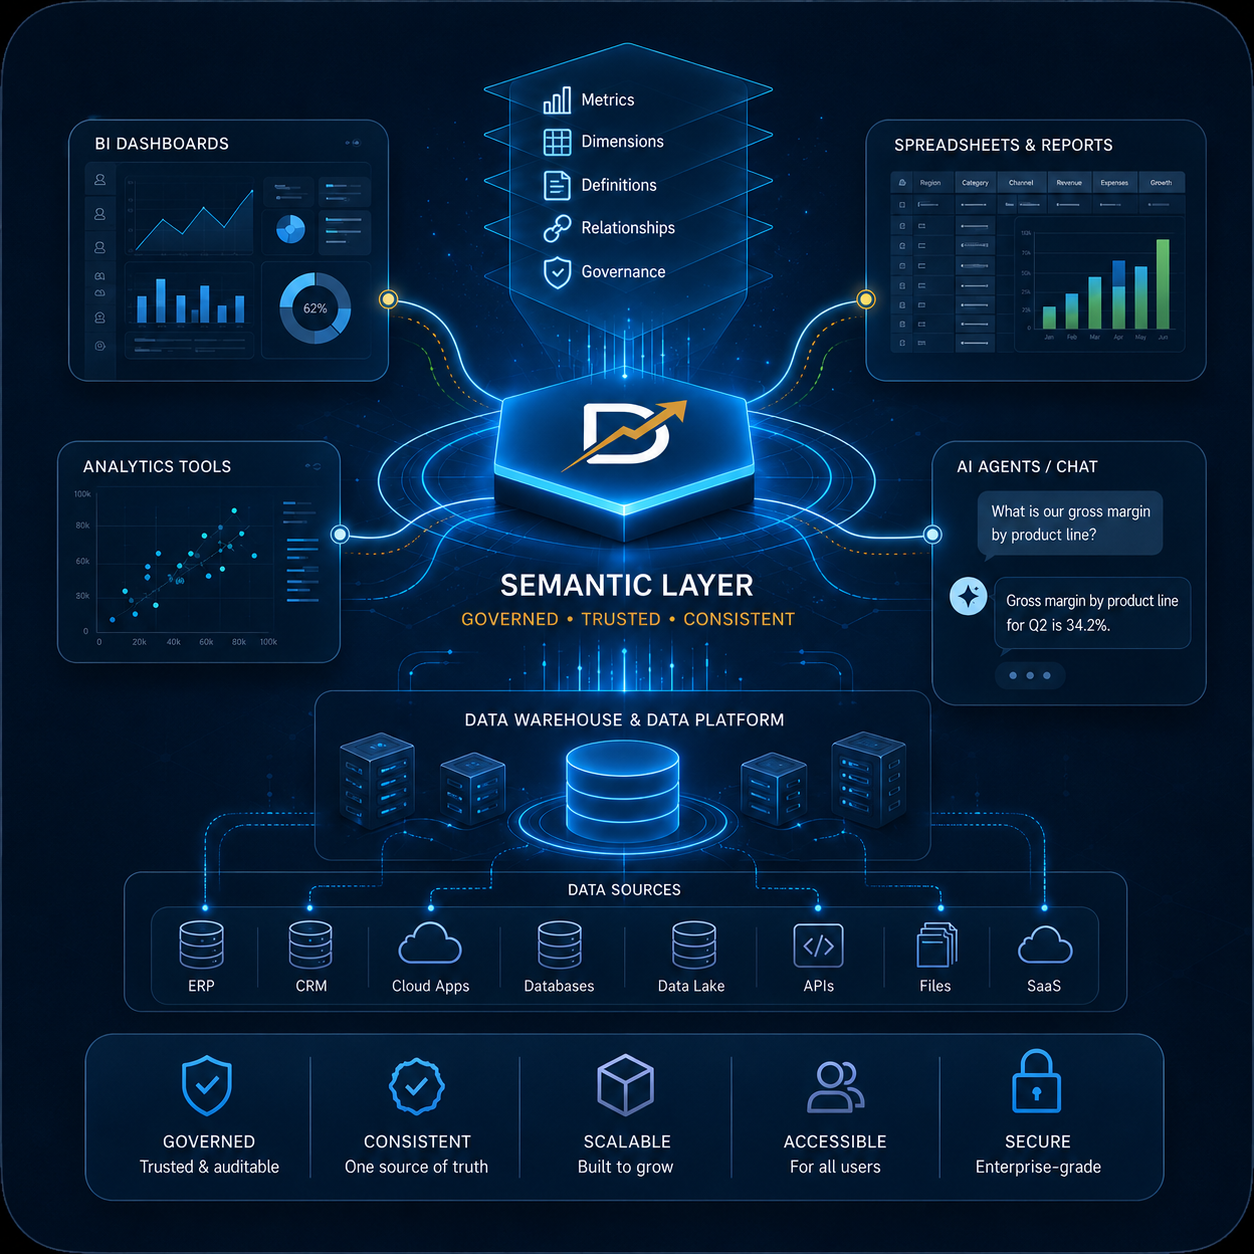
One governed metric layer. Every consumer reads from it.
BI dashboards, spreadsheets, analytics tools, and AI agents all reading from the same canonical definitions — sitting on top of your data warehouse and data sources, governed end-to-end.
Stabilize → Improve → Leverage
A repeatable, three-phase pattern proven across five industries and twenty-plus transformations — applied specifically to the work of building, deploying, and governing a semantic layer.
Five industries. One pattern of work.
Different operating contexts, the same data problems — and the same playbook for solving them.
Scaling BI through 3.4× growth at a fast-growing QSR chain.
Eight years inside the BI function.
Eight years inside the chain’s BI function as it scaled from 250 to 850 restaurants. Migrated 15 TB to Snowflake on AWS. Replaced Sisense with Tableau company-wide in 120 days. Cut daily reporting SLA by 2 hours and reduced contractor spend by $200K while supporting 20% annual growth.
Read the case →Notes on the semantic layer.
The semantic layer just became infrastructure.
Five years ago this was a niche analytics-engineering term. As of January 2026, Gartner is calling it non-negotiable infrastructure on the same line as data platforms and cybersecurity.
AI accuracy is a metric definition problem.
Text-to-SQL drops 50%+ on real enterprise warehouses. It climbs back to 90%+ with a semantic layer between the model and the data. The model isn’t the bottleneck. The metric layer is.
Day-2 architecture for the semantic layer.
Most semantic layers we see were designed for the company the team had eighteen months ago. Three Day-1 mistakes we see constantly, three questions to ask before naming a metric, and why rebuilds cost 5–10× what foresight does.
Ready to talk?
Every engagement begins with a complimentary 60-minute discovery conversation. No commitment. Goal is to understand your situation, confirm whether there’s a fit, and outline what a tailored engagement could look like.